We experienced heavy shifts in temperature and weather patterns. Climate change is related to natural shifts and much more beneficial human activities. The broadcasted news articles related to climate change and the rise of natural disasters describe various cases.
A massive knowledge graph saves the extracted semantic entities of the broadcasted news worldwide. Understanding the spatial patterns of such a massive knowledge graph is often difficult for non geospatial experts. Finding hotspots of mentioned locations is one common use case. News article contain various location entities. These locations not only represent the event location. But, the knowledge graph allows the extraction of the mentioned locations related to a specific theme. So that we can extract every mentioned location using news related to natural disasters.
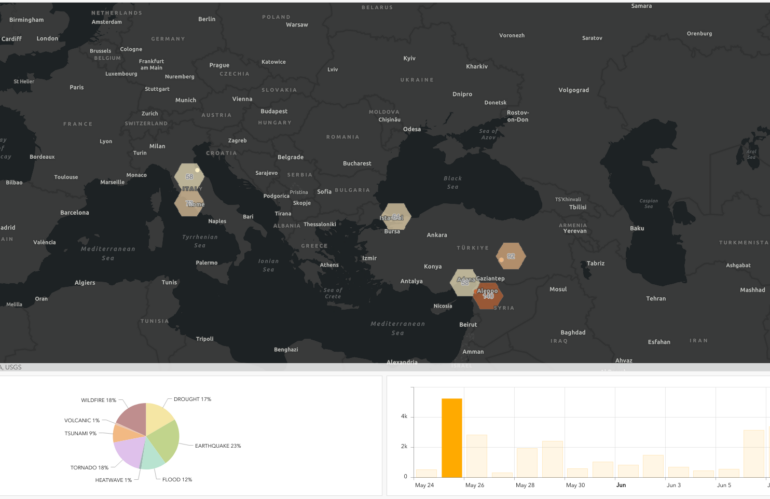
Geospatial features derived from broadcasted news provide a valuable resource for understanding and responding to natural disasters. By identifying hotspots and aggregating them using a spatial grid, we can gain insights into the spatial distribution and severity of these events. Accessing geospatial features daily enables active monitoring, response planning, and resource allocation. Continued advancements in geospatial analysis and data availability will further enhance our ability to mitigate the effects of natural disasters and build resilient communities.