To achieve political goals, we have seen people and governments using political violence. It includes violence between governments, e.g. war as an intense armed conflict, and violence used against non-state actors, e.g. police brutality. A rebellion is a kind of politically motivated violence of non-state actors against a government. The storming of the United States Capitol was a riot act from non-state actors against the United States Congress.
Political violence is a major public health problem, not only because of the direct consequences but also because of the long-term effects on health and well-being of our communities. As a geospatial intelligence engineer, you need access to high-quality open source intelligence (OSINT) data collections for various geospatial tasks. We are going to inspect one high-quality OSINT data collection and use their geospatial information for spatial data science and political violence mapping.
Professor Clionadh Raleigh from the University of Sussex and her co-authors introduced the Armed Conflict Location & Event Data (ACLED) Project in a paper being published by the Journal of Peace Research in 2005. The paper shows the importance of disaggregated data collections using local specific high-quality information over location and time. In the past, researches often used national-level data only, which leads to erroneous conclusions.
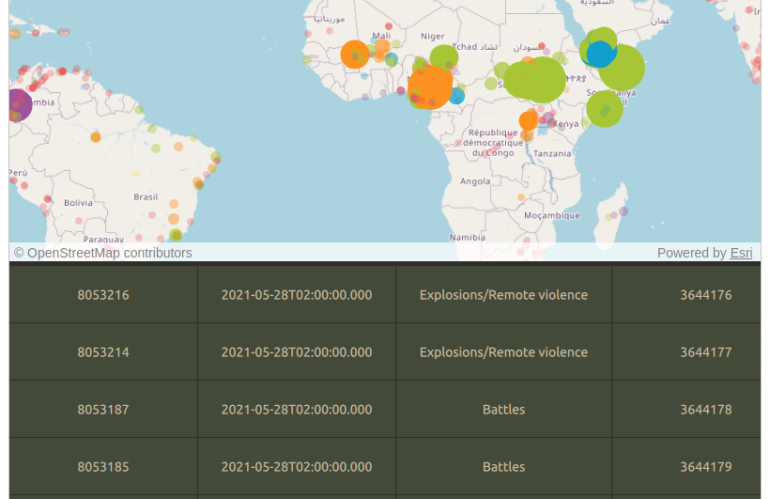
The ACLED explorer is a desktop map application visualizing occurred events worldwide. It consumes a publicly available geospatial cloud service and uses the official Open Streetmap map service as a basemap layer. The table view shows the events of the current map view extent. By navigating the map, the table view automatically filters the underlying event layer.
Armed Conflict Location & Event Data Project (ACLED)
Raleigh, Clionadh, Andrew Linke, Håvard Hegre and Joakim Karlsen. (2010). “Introducing ACLED-Armed Conflict Location and Event Data.” Journal of Peace Research 47(5) 651–660